Welcome to another episode of Fitogether Vision & Insights! Your go-to source for staying at the forefront of sports science and technology. Our weekly updates deliver a curated blend of sports insight and knowledge!
Practitioners are required to master the balance between progressing training loads to improve chronic fitness whilst keeping players fresh so they can perform optimally on match day(1). Then you might wonder, how to do this?
Assessing whether players are positively or negatively adapting to training programmes throughout the season may be revealed by assessing relationships between internal and external load metrics. Now, in this blog, we will study the concept behind internal-external load relationships and how they can be applied in practice using OHCOACH Analytics, with our Lead Sports Scientist, Dr. Elliot Lam!
Internal and External Training Load: A Recap
External load metrics quantify the physical workload imposed on players during training and matches (1). Examples available in OHCOACH include total distance, high-speed running, accelerations, decelerations, and ACD load, all measured by the GPS and accelerometer.
And how about internal load? Internal load metrics quantify the physiological and / or psychological response of players to the external load performed, which ultimately provide the stimulus for training adaptations over time (2). Examples include the Rating of Perceived Exertion (RPE) scale as a subjective indicator and heart rate (HR) metrics (such as average HR, time spent > 85% HR max, HR variability, and HR recovery) as objective indicators (2).
Attached is an example on Fitogether Analytics, showing how we provide practitioners with GPS, accelerometer, heart rate, and RPE metrics in their Team and Individual Player dashboards. This enables a comprehensive, multivariate analysis of training load!
Understanding Internal-External Load Relationships
Now, let’s talk about the relationship between those two. Let’s give a silly example of a Premier League footballer and myself (an author who has no fitness!) running 8 km in a football match. If we only look at the external load, it seems we've done the same work: 8 km. However, my RPE rating and heart rate response (e.g. RPE 10, average HR = 90% of maximum HR) would be much higher than the footballer's (RPE 7, average HR = 70% of maximum HR) because they are more conditioned to handle the effort.
Therefore, understanding the relationship between internal and external load measures may help practitioners analyse the effectiveness of planned training programmes and determine when interventions need to be made throughout a season (3). The criteria below present simplified interpretations to determine player status (4):
- Fitness - If the internal load response to the same external load decreases (increasing the ratio value between external: internal load), this may indicate that players are becoming more conditioned. This is a desired objective in pre-season to prepare players for competition and for players to sustain fitness during the in-season phase.
- Fatigue - If the internal load response to the same external load increases (decreasing the ratio value between external: internal load), this may suggest that a player is fatigued and / or deconditioned. This may occur due to a lack of match time in-season, overtraining and players first returning from injury. Whilst higher HR responses may be used to assess physiological fatigue, increases in RPE responses may elucidate psychological fatigue or stress affecting player mindsets. This can then be associated with player readiness or wellness monitoring.
- Pacing - If both internal and external load metrics decrease (maintaining similar ratio value between external: internal load), this may suggest that players are consciously reducing their output and are not necessarily fatigued. Thus, improvements in performance may require motivational or tactical intervention (2).
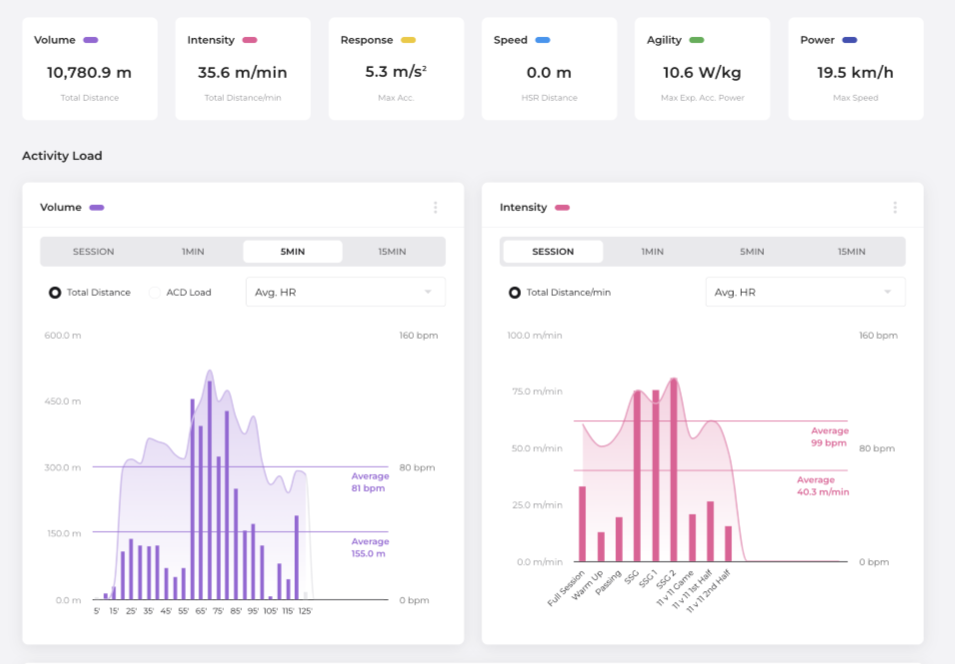
Fitogther Analytics enable internal load measures (such as average HR) to be graphed with external load metrics (such as total distance) for individual players over the course of an activity for practitioners to visualise training load relationships!
Tips To Analysing Internal-External Load Relationships as a Practitioner
1) Focus on studying the relationship between internal and external loads within individual players, rather than comparing across different players.
This approach is crucial because contextual factors such as genetics, nutrition and psychological status can also vary a player’s internal response to the same external work across a squad (2). Therefore, it's best to track changes within the same player over time.
The choice of internal and external load metrics to relate that may be most associated with changes in fitness or fatigue may also differ between players, although common relationships studied include total distance, high-speed distance and average speed with RPE, average HR and HR exertion (4),(5). A practitioner should start by using the internal and external metrics that they commonly analyse in isolation.
2) Familiarise yourself with typical external and internal load metric values for particular activities and sessions.
As you begin to collect consistent data throughout a season, start to eyeball the data and note instances where player’s RPE or heart rate responses are unusually higher for external loads typically performed in consistent training activities or drills performed each week (6).
You could establish averages and standard deviations of a player’s internal load metrics to consistent training activities and drills in a spreadsheet, observing when a value is recorded above their normal variation (Difference of > 1 standard deviation). If this is related to a similar external metric output to their average, this may flag when a player should be further assessed for signs of fatigue or deconditioning before an intervention is necessary.
3) Continue to collect consistent, longitudinal data sets across a season to allow more robust analysis of internal-external load relationships.
Plotting the internal load response of a player against an external load metric value (i.e. Total Distance vs. Average HR) for all activities completed over an entire season or seasons can be used to form a player’s regression equation 6. This equation can then be used to predict internal load responses to external loads completed by that player in future activities (6).
Activities or periods of a season where actual internal loads are lower or higher than predicted internal loads may indicate phases where the player is increasing fitness or struggling with fatigue respectively (2),(6). More sophisticated machine learning techniques have also been applied to construct models predicting internal load responses from external load (7).
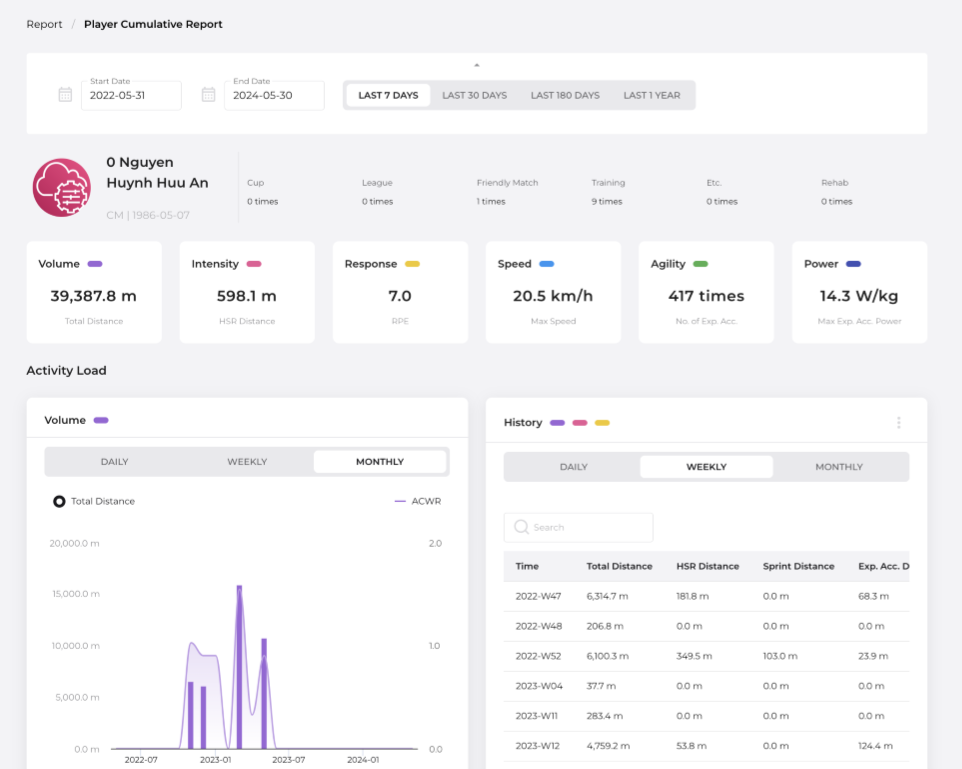
Fitogether Analytics’ Player Cumulative Dashboard enables historical analysis of an individual player’s internal and external load metrics across every activity completed to help practitioners establishing training load relationships!
Specific Activities and Sessions to Analyse Internal-External Load Relationships
1) Matches
Across the course of a match, starters will likely fatigue during the 2nd half of matches. Assessing when a internal-external relationship uncouples, and internal load starts to increase without a further increase in external load can be indicative of when players begin to fatigue (8).
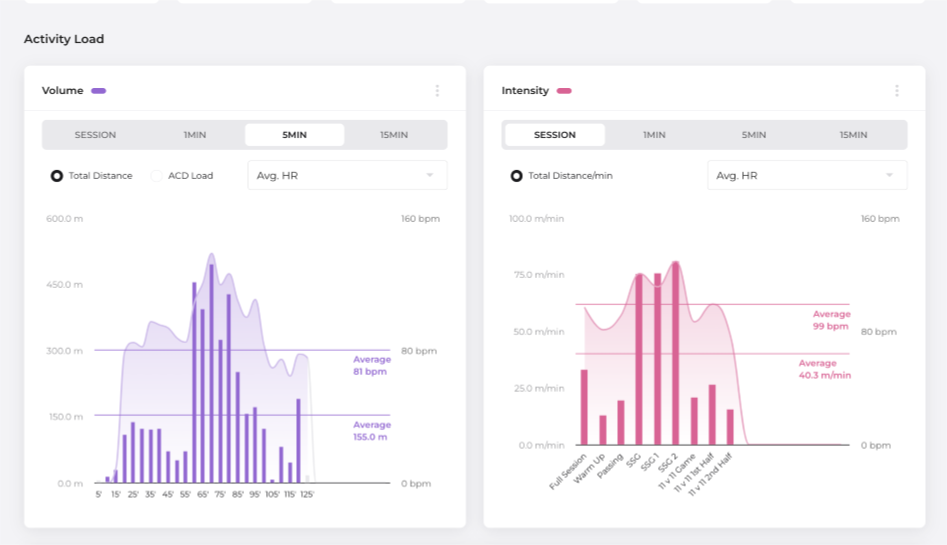
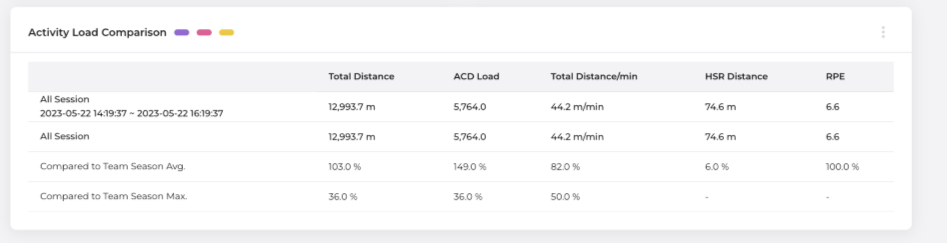
Fitogether Analytics’ Activity Load Graphs can quantify internal and external load trends over 1 min, 5 min and 15 min periods to identify when internal-external relationships uncouple and reveal when players potentially start to fatigue in matches.
2) Sided Games
Determining internal-external load relationships in a consistent small-sided or large-sided game performed on a particular training day each week (for example, 5 v 5 in a 25 x 40 m area on a MD-2) is ideal as external load values should be reasonably consistent.
Analysing how an individual player’s internal load response increases or decreases each week, outside of their normal variation for this drill, can help flag when players are fatigued and reduce the burden that regular fitness testing would have during the congested, in-season phase for teams (9), (10).
Fitogether Analytics’ Multiple Session (Drill) Feature enables practitioners to analyse complete training drills and the demands of individual sets simultaneously (i.e. 3 x 5 mins) to comprehensively assess each players’ internal and external load.
3) Sub-Maximal Fitness Testing
Teams that can analyse internal-external load relationships using sub-maximal fitness testing employed in warm-ups or as part of particular training days each week are another solution in reducing the burden of all-out fitness testing in-season (6).
Assessing the internal load response of the last phase of a short, continuous submaximal fitness test (for example, analysing the average HR compared to total distance of the final min completed of a 5 min continuous run) can be used to monitor players’ fitness status in-season (9), (11). Monitoring training load relationships in both submaximal fitness tests and sided games can also be used together to monitor players’ generic / cardiovascular and sport-specific fitness respectively (9), (10).
So, you know that balancing training loads is crucial for keeping players fit and ready for matchday. By understanding the relationship between internal and external load metrics, you can make better decisions to enhance player performance and prevent fatigue. By employing the advanced capabilities of OHCOACH Analytics, you can comprehensively assess and visualize these relationships, making data-driven decisions to enhance player performance and prevent overtraining!
Want to learn more about how Fitogether can help your team? Give our representatives a call and let’s have a chat about how we can support your team!
References
- Impellizzeri FM, Rampinini E & Marcora SM (2005). Physiological assessment of aerobic training in soccer. J Sports Sci 23, 583–592.
- Impellizzeri FM, Marcora SM & Coutts AJ (2019). Internal and External Training Load: 15 Years On. Int J Sports Physiol Perform 14, 270–273.
- Scott BR, Lockie RG, Knight TJ, Clark AC & Janse de Jonge XAK (2013). A comparison of methods to quantify the in-season training load of professional soccer players. Int J Sports Physiol Perform 8, 195–202.
- Akubat I, Barrett S, Sagarra M & Abt G (2018). The Validity of External:Internal Training Load Ratios in Rested and Fatigued Soccer Players. Sports 6, 44.
- Buchheit M, Cholley Y & Lambert P (2016). Psychometric and Physiological Responses to a Preseason Competitive Camp in the Heat with a 6-Hour Time Difference in Elite Soccer Players. Int J Sports Physiol Perform 11, 176–181.
- Clubb J (2023). How to Combine Internal and External Training Load Monitoring. Available at: https://www.youtube.com/watch?v=LAuPyif1Czk [Accessed 27th May 2024].
- Bartlett J, O’Connor F, Pitchford N & Torres-Ronda L (2016). Relationships Between Internal and External Training Load in Team Sport Athletes: Evidence for an Individualised Approach. Int J Sports Physiol Perform 12, 230-234.
- Torreño N, Munguía-Izquierdo D, Coutts A, de Villarreal ES, Asian-Clemente J & Suarez-Arrones L (2016). Relationship Between External and Internal Loads of Professional Soccer Players During Full Matches in Official Games Using Global Positioning Systems and Heart-Rate Technology. Int J Sports Physiol Perform 11, 940–946.
- Clubb J (2023). What is Invisible Monitoring in Sports Science? Available at: https://www.youtube.com/watch?v=LAuPyif1Czk [Accessed 27th May 2024].
- Lacome M, Simpson B, Broad N & Buchheit M (2016). Monitoring Players’ Readiness Using Predicted Heart-Rate Responses to Soccer Drills. Int J Sports Physiol Perform 13, 1273–1280.
- Shushan T, McClaren SJ, Buchheit M, Scott TJ, Barrett S and Lovell R (2022). Submaximal Fitness Tests in Team Sports: A Theoretical Framework for Evaluating Physiological State. Sports Med 52, 2605-2626.
.png)
.png)