Welcome to another episode of Fitogether Vision & Insights! Your go-to source for staying at the forefront of sports science and technology. Our weekly updates deliver a curated blend of sports insight and knowledge!
Have you ever wondered how teams analyze their performance and turn raw data into actionable insights?
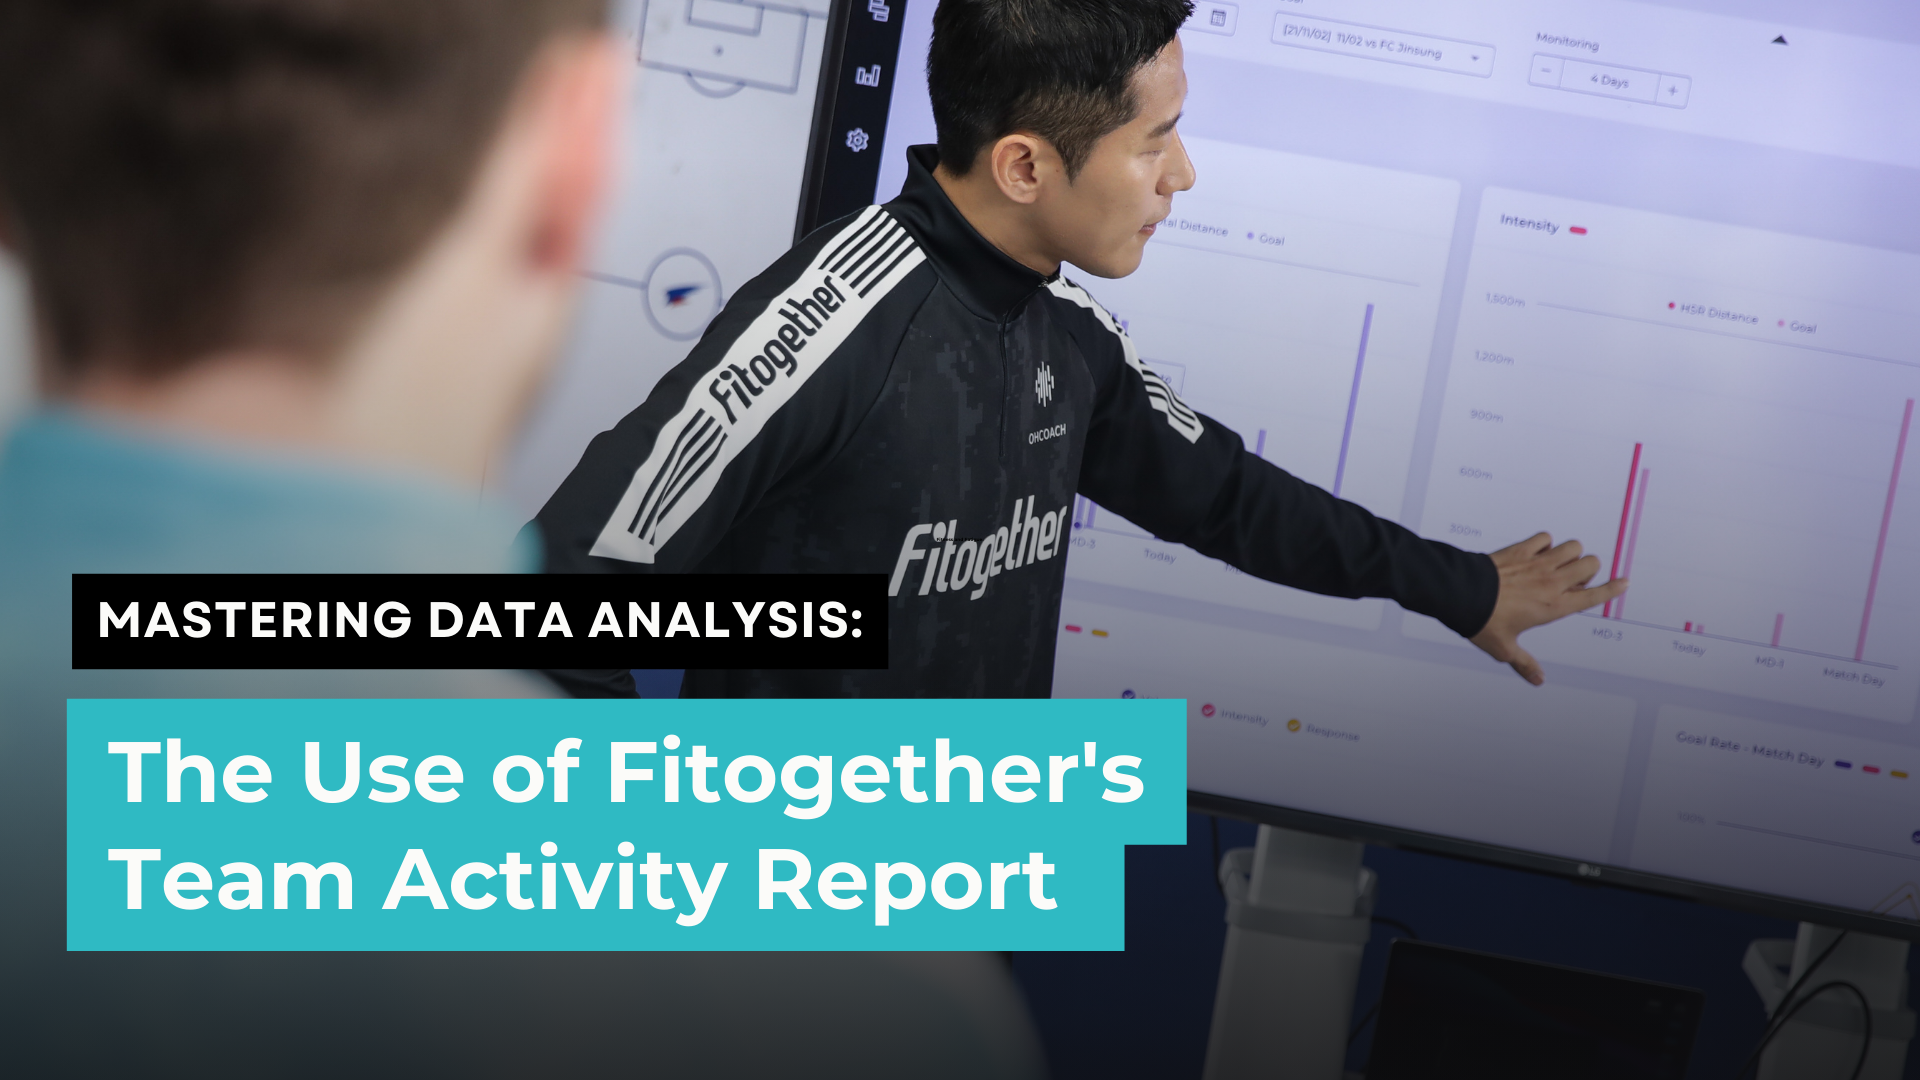
The answer lies in our ultimate software, such as Fitogether Team Activity Report.
Previously, we discussed how to optimize training strategies by using Sessions in Fitogether as a common task in your workflow. After creating sessions, you can analyze their performance and turn raw data into actionable insights with our Team Activity Report.
The Team Activity Report is designed by OHCOACH to help practitioners with an array of useful graphs and tables. These tools analyze data and convey meaningful insights to coaches, players, and performance staff.
The Team Activity Report report isn't just about numbers – it translates data into strategies that can optimize team and individual performance. It includes various features that are crucial for understanding performance metrics. This blog explores the various features within the Team Activity Report and how these can be maximised by practitioners to optimise team and individual performance.
1. Summary Boxes
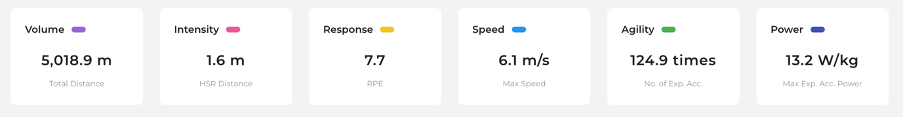
What do they show?
- These numbers show you an overall team average for all players included within the activity for six key metrics defined by the practitioner.
How can they be used?
- Provide a quick and simple overview of the work completed by the team for easy comparison with previous activities.
- Help convey simple message to coaches on whether physical objectives were achieved in this activity.
2. Activity Load Graphs
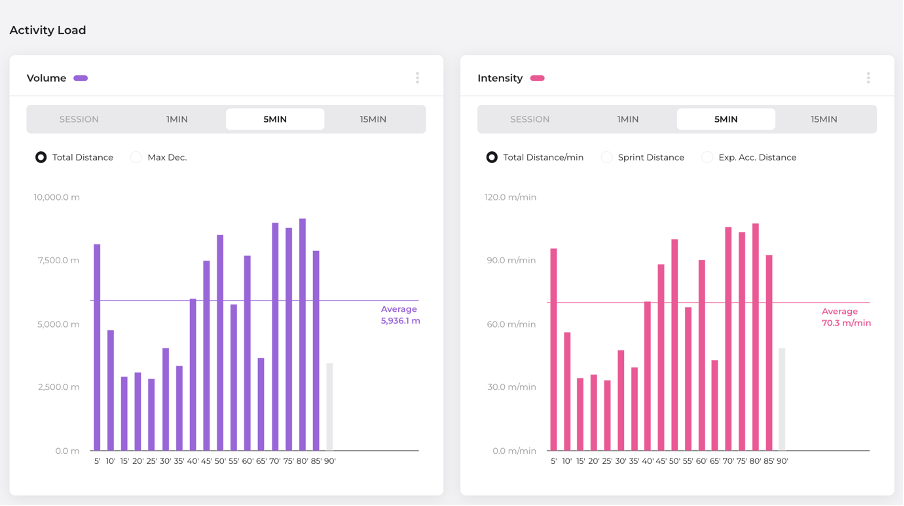
What do they show?
- These graphs will accumulate the data collected for selected metrics from all players involved in created sessions, or over 1 min, 5 min or 15 min periods across the entire activity depending on the function selected.
- For load-based metrics (e.g. Total distance), data is added up from all players involved in each period whilst for intensity-based metrics (e.g. Total distance / min), data is averaged from all players involved in each period.
How can they be used?
- For match activities, you can simply view which periods the team was performing at higher or lower intensities and associate these patterns with performance, possession or other tactical / technical objectives to communicate with coaching staff.
- Help visualise the drop off in intensity across an activity to assess the influence of fatigue or the effect of substitutions across matches.
- For training activities, you can simply view which drills elicited the highest intensities and whether these values are comparable to typical match values for optimal player preparation.
3. Physical Performance Graphs
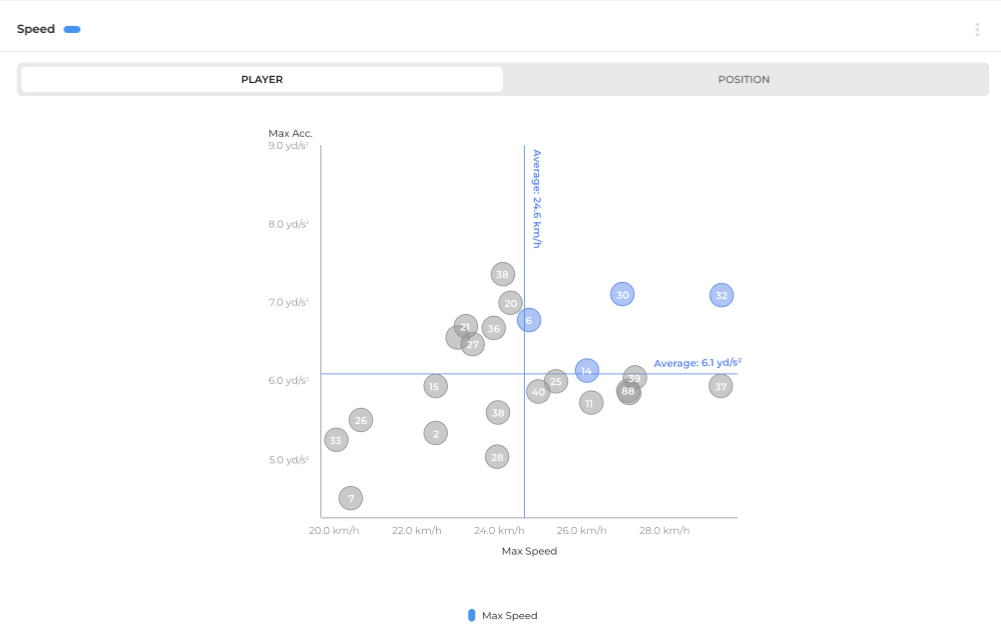
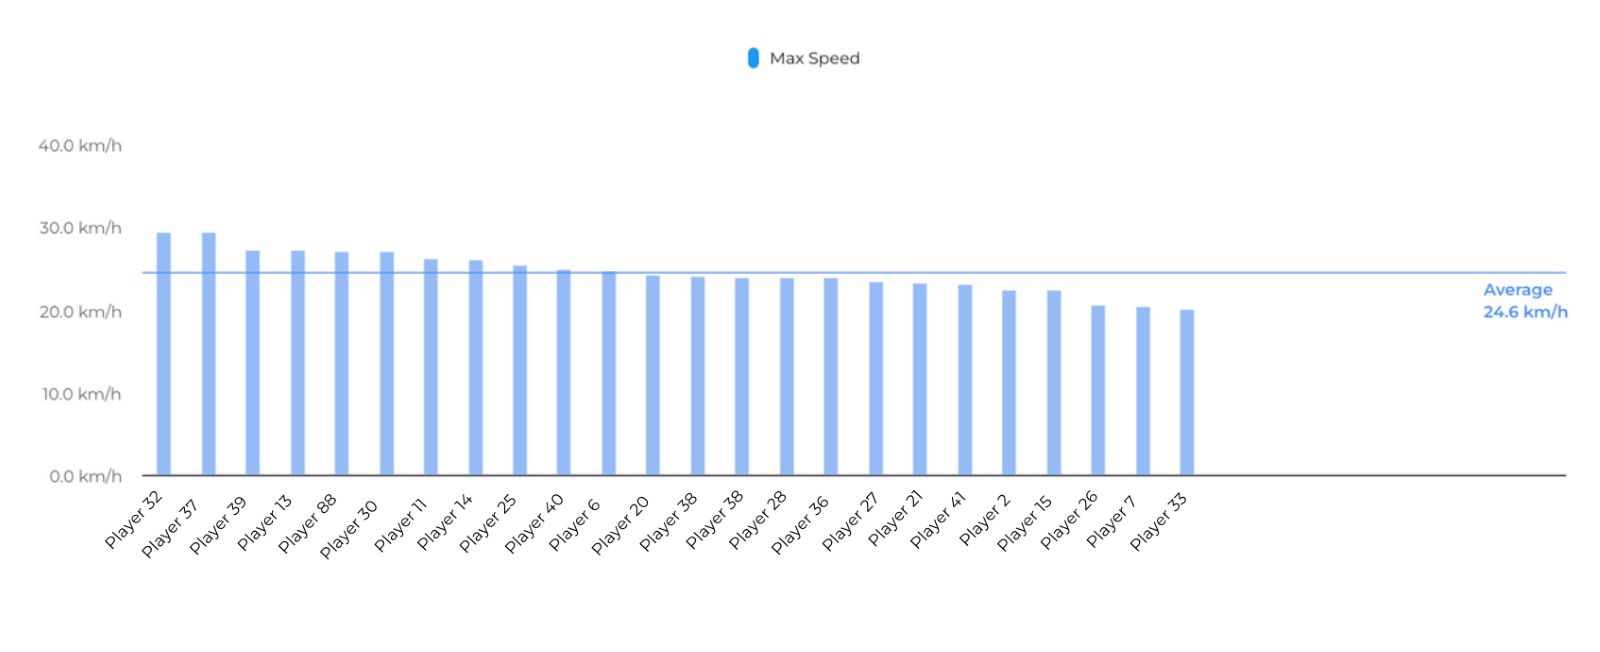
What do they show?
- These graphs will map two high-performance metrics and show how each player (represented by jersey numbers in the circles) performed in relation to the team average (indicated by the lines) during an activity.
- Players in the top-right quadrant of the graph performed above team average in both metrics measured and will be highlighted.
- Individual metrics are also graphed underneath where players are ranked from the highest to lowest values achieved.
How can they be used by a practitioner?
- To physically benchmark players and see who consistently performs above average in both high-performance metrics, which may represent higher physical qualities and capabilities to step up to 1 team level when assessing younger players.
- Identifying individual players' strengths and weaknesses (e.g. who is stronger at max speed but weaker in acceleration, or someone who is high in acceleration but low in deceleration) which may help prescribe gym and on-pitch conditioning programmes.
- The individual bar graphs ranking player performance could be useful for assessing which players have hit their planned maximal targets in the activity (e.g. assessing the max speed achieved).
- You can also choose to view these graphs by position instead of player within the report, which can allow you to compare positional profiles within sessions and guide position-specific training.
4. Session Details Table
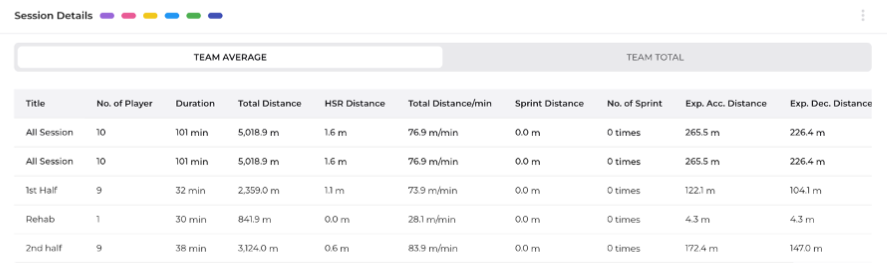
What does this show?
- This table will give you overall team averages or overall team totals for the whole activity and for created sessions / drills within the activity.
- Practitioners can select various metrics and decide the order they want to view them in this table.
How can this be used by a practitioner?
- Assess the relative contributions of various sessions towards the overall activity goals and evaluate whether key performance metrics were met within certain drills (e.g. large-sided drills for meeting HSR and sprint running goals, small-sided drills for meeting acceleration / deceleration goals).
- Directly compare performance within drills that can be displayed and communicated simply for coaches, players and performance staff (e.g. comparing 1 and 2 half sessions within a match activity to assess intensity and fatigue).
- Constructing a drill database to help prescribe the load and intensities for planned training sessions in the future.
5. Player Details Table
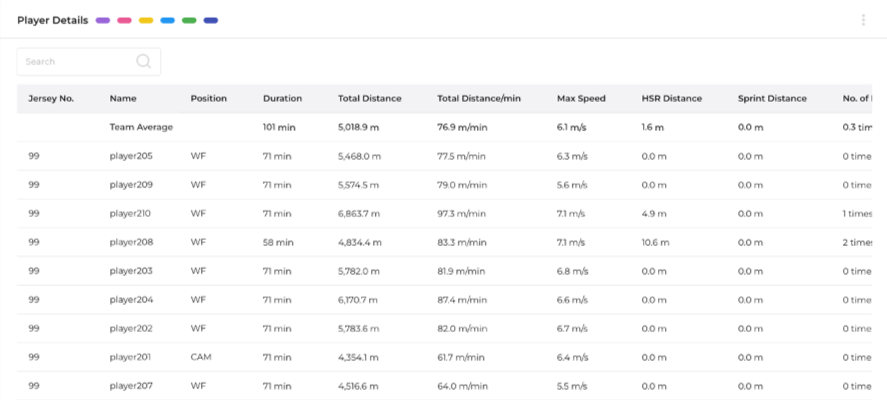
What does this show?
- This table will give you individual player data for the overall activity or sessions selected at the top of the report.
- Practitioners can select various metrics and decide the order they want to view them in this table.
How can this be used by a practitioner?
- Access to the largest range of metrics in this table (over 200) gives freedom on how to quantify individual performances and allow practitioners to monitor, manage and prescribe loads specific for each player. This is aided by sorting metrics from highest to lowest to see which players have hit physical objectives from a team and individual perspective.
- Ability to compare player statistics within a particular activity which may help assess physical capabilities, conduct within-position analyses and convey physical performance outputs to coaches.
- This table will be commonly exported as a .csv file to help construct practitioners’ databases for further in-depth analysis. The ability to export individual data for all sessions created and the overall activity in one file, with numerous tagging variables applied (i.e. Activity type, position), helps practitioners speed up this process.
How Fitogether Makes a Difference?
One word - we just make it simple. At OHCOACH, we believe in keeping things simple. Our goal is to make complex data easy to understand.
Our intuitive interface ensures that everyone—from coaches to players—can benefit from the insights we provide.
Exciting important news! We’re also planning to bring out fully customizable reports tailored to your specific needs. Our upcoming report renewal update will replace the current Team Activity Report with even more advanced features. Stay tuned for more details.
In the meantime - we’d love to chat with you! Set up a free consultation with one of our experts here!
It’s your turn to gain a competitive edge through data-driven insights.
.png)
.png)