Achieving Excellence through Detailed Data.

Designed for Coaches who need
with Customized Thresholds
with IMU
with Tableau
Hardware
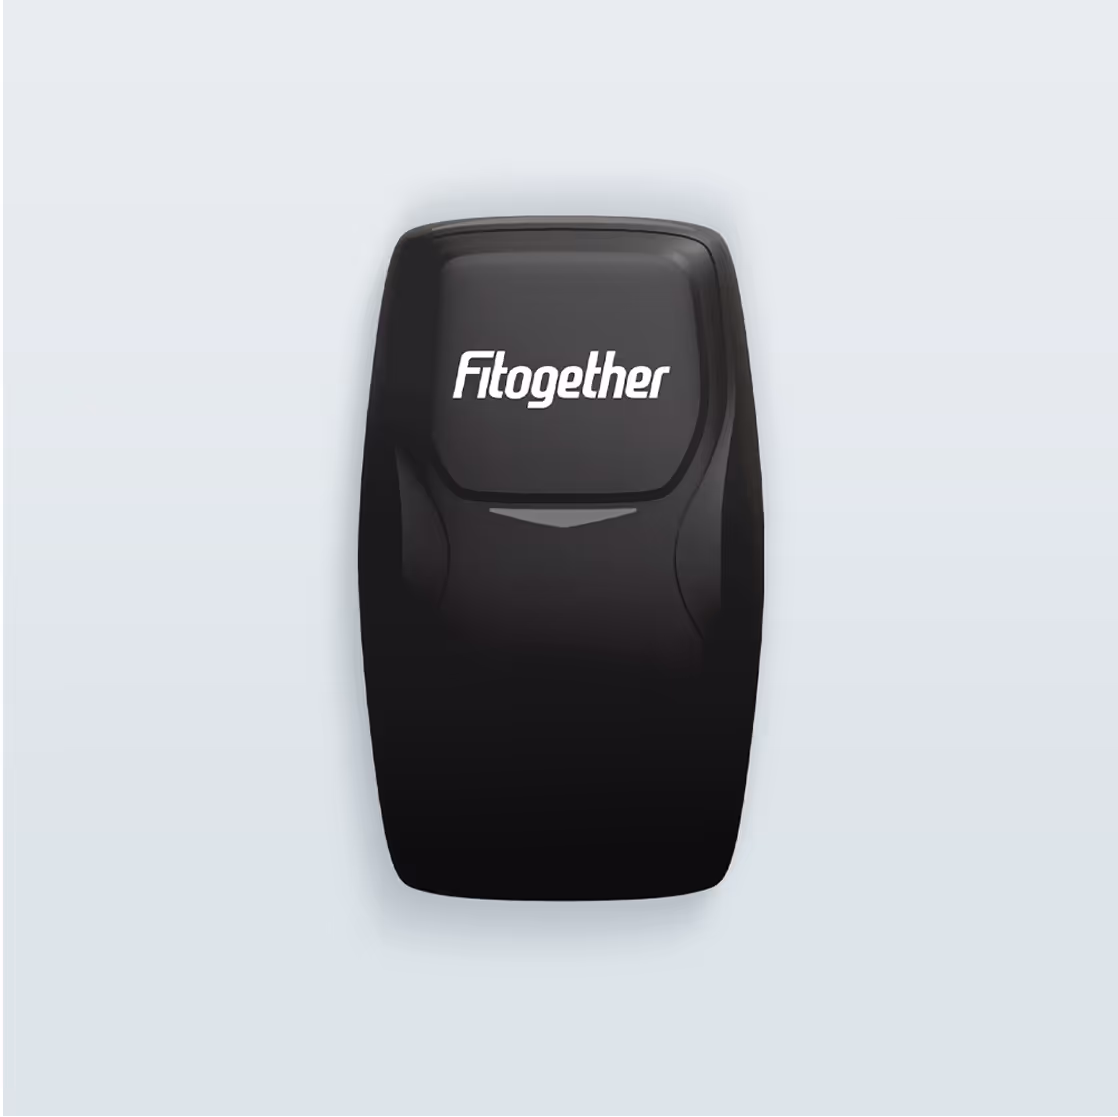
Cell X
Cell is Fitogether’s wearable device for precise recording of player movements and performance metrics.
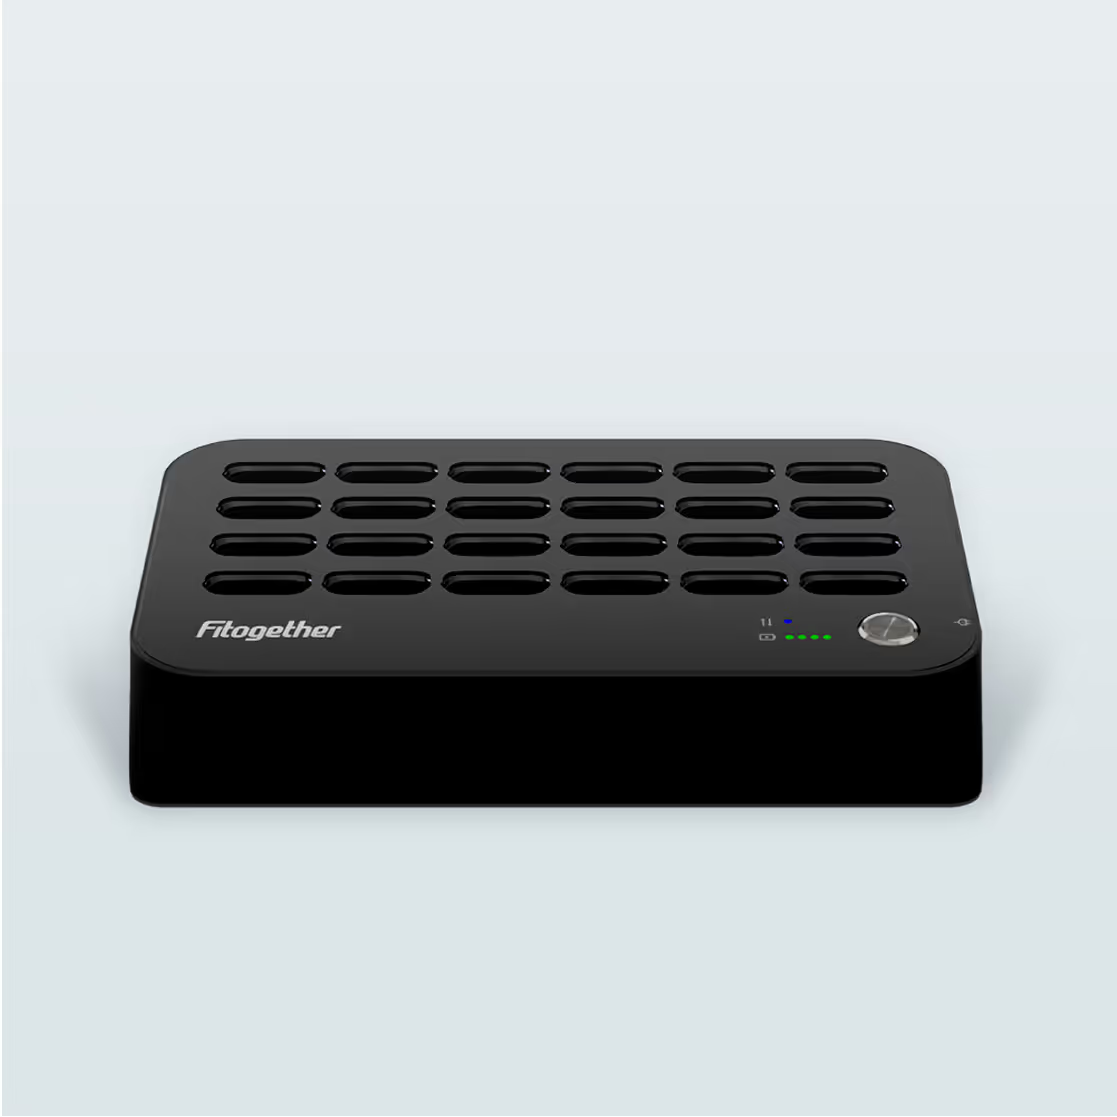
Dock
Dock is a multifunctional device that enables simultaneous data upload and charging for Cells.
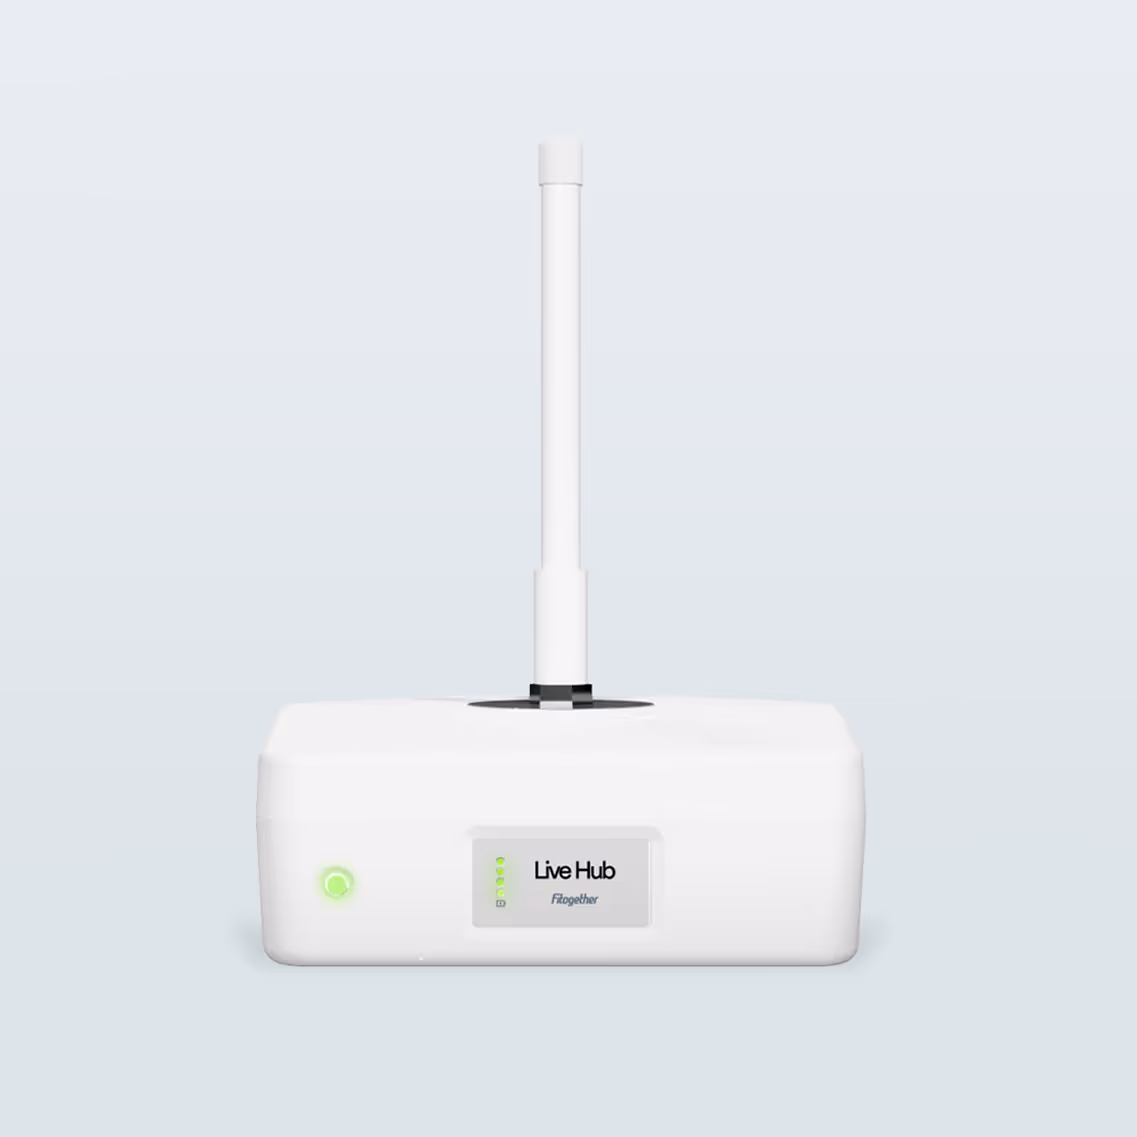
Live Hub
LiveHub enables real-time data transmission for instant performance insights during training and matches.
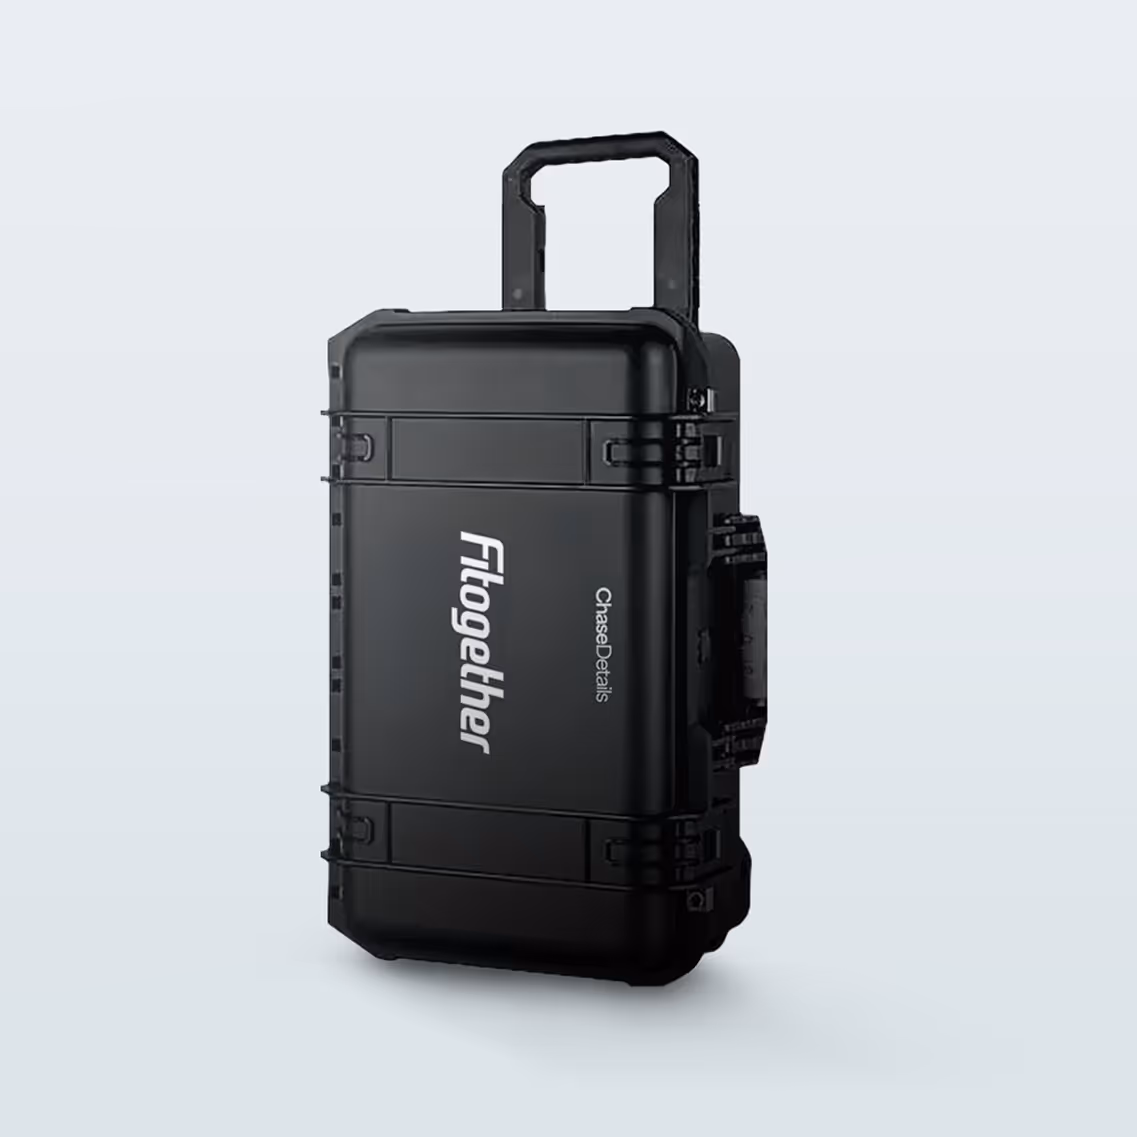
Trolley Case
Case is a durable carrier for safely storing and transporting Fitogether’s hardware.
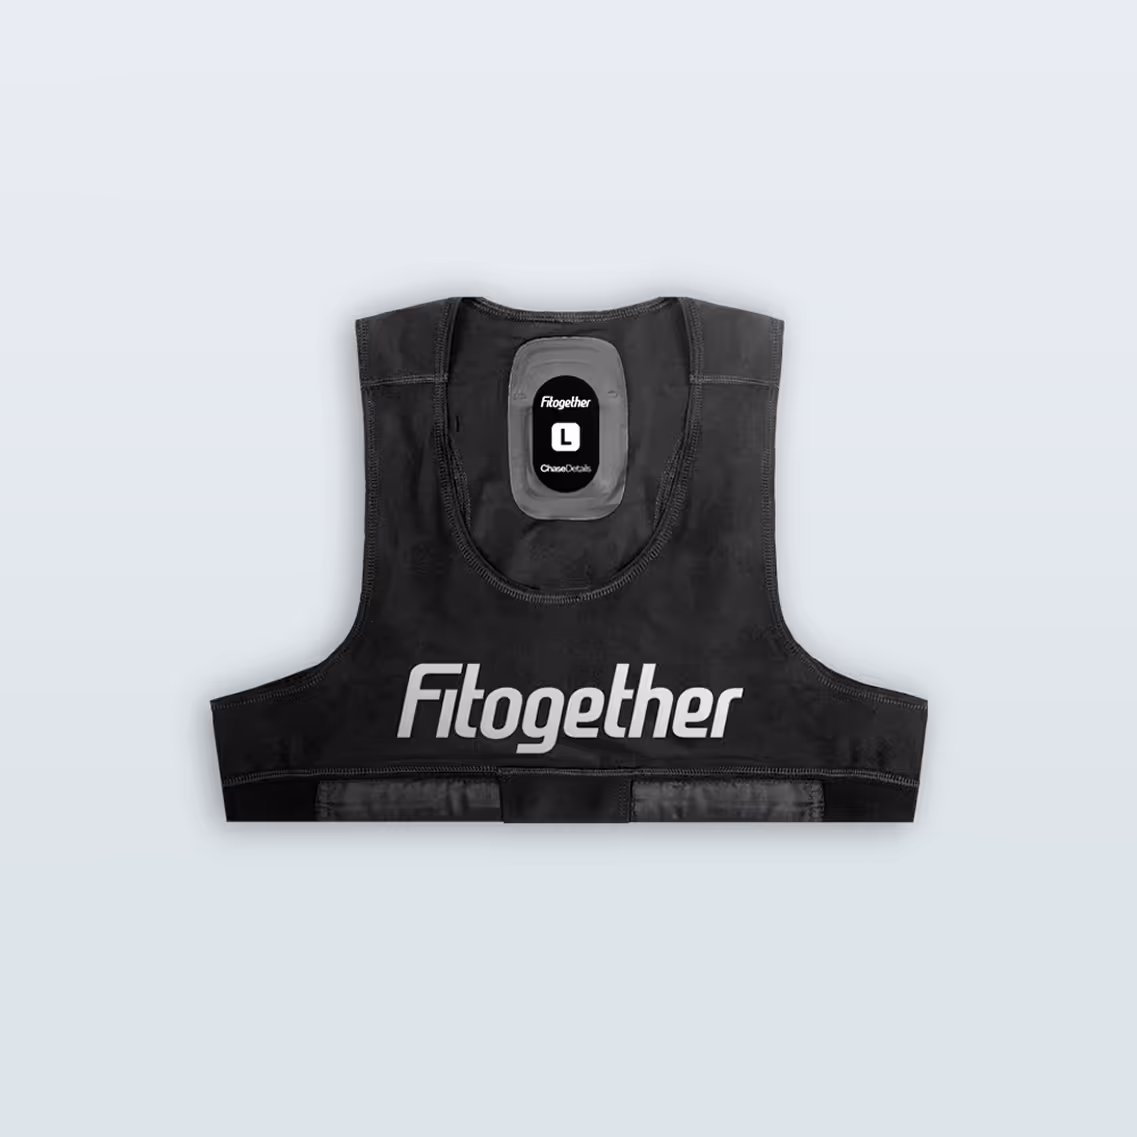
Vest
Vest is designed to securely hold Cell for stable data tracking. Multiple vest options available for different user needs.
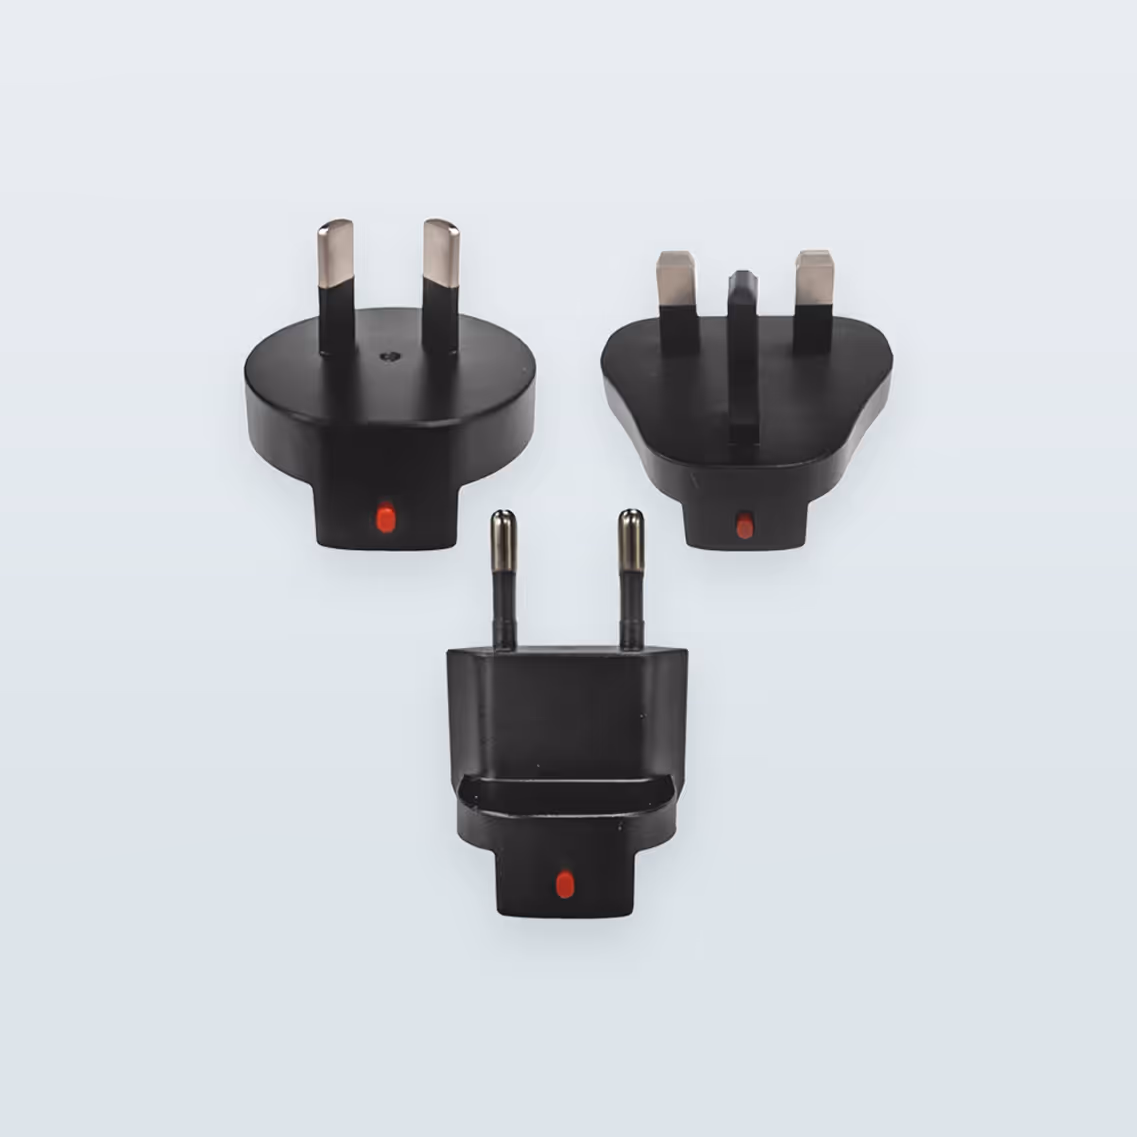
Standard Accessory
Essential accessories for charging, data transfer, and setup—supporting smooth daily operation at home and away.

Optional Accessory
Purpose-built accessories for specific needs, available separately to support advanced or customized operations.
Software
Frequently Asked Questions
Yes, you can. The Data Portal supports integration with a wide range of external data sources—including other EPTS devices, heart rate monitors, and physical testing tools—via CSV or XML formats. If you're using Power BI, the Bulk Export feature allows you to selectively export only the metrics you need. One of the key strengths of the Advanced package is its ability to consolidate and analyze multiple data sources within a single, unified platform.
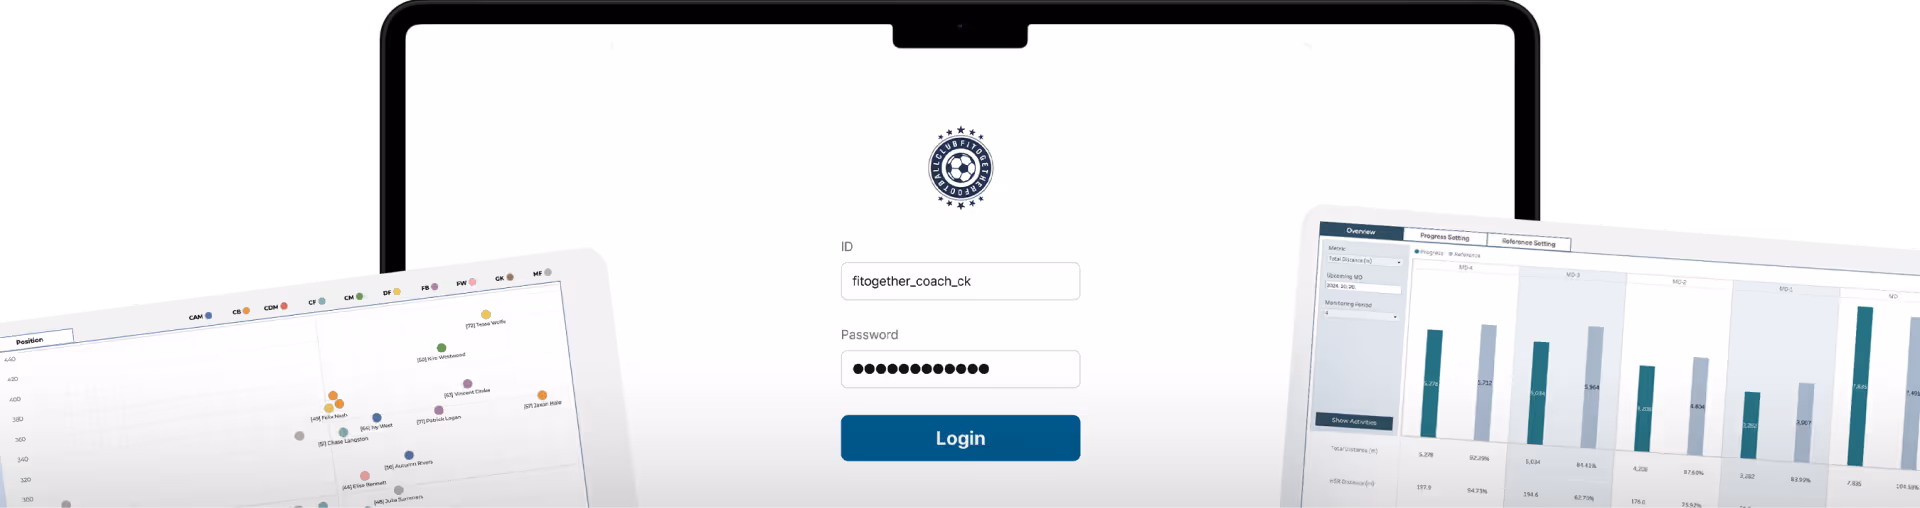
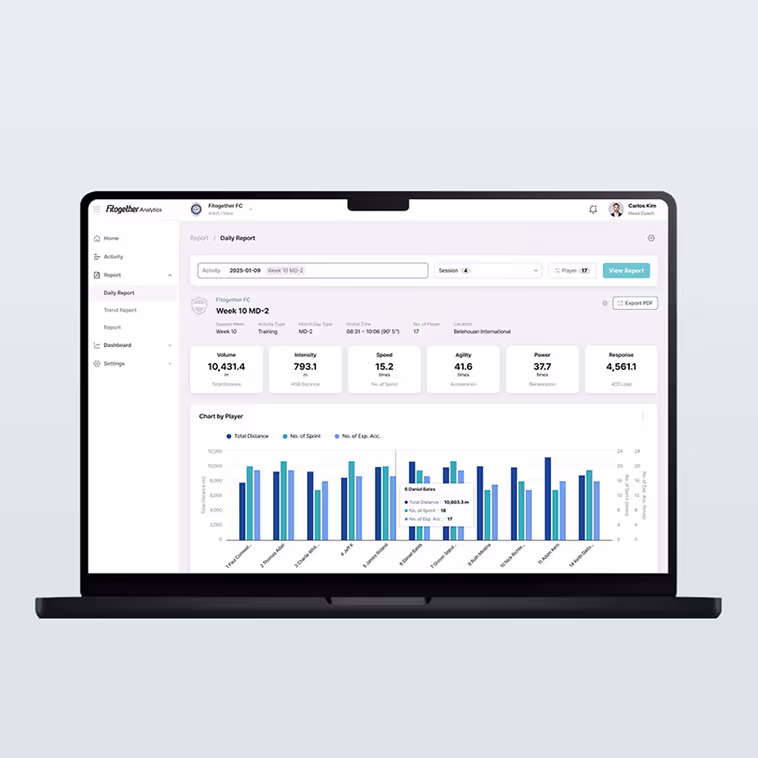
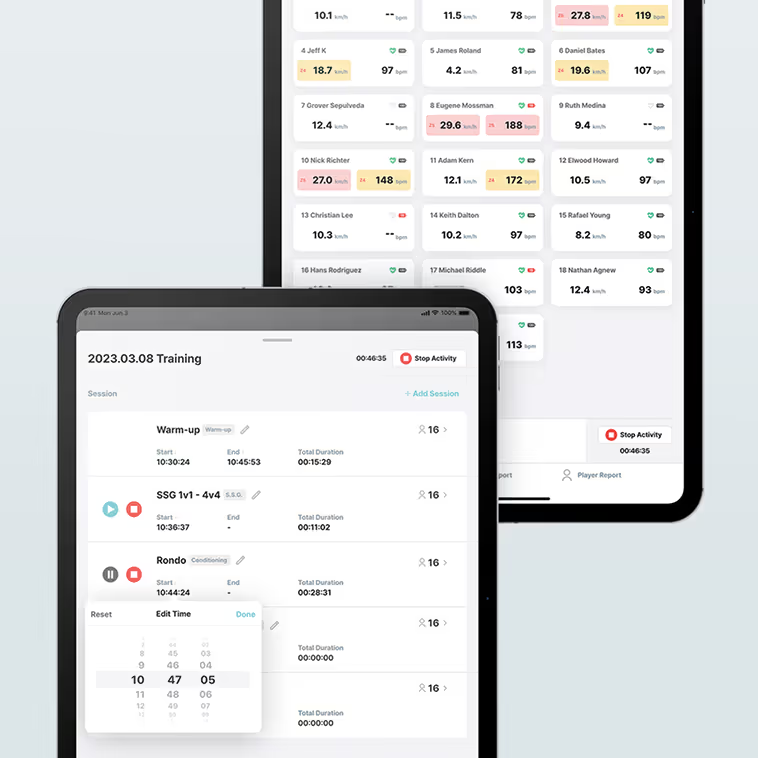
In Analytics, you can set custom thresholds and workload zones for each player, which can be adjusted week by week throughout the season. All changes are automatically recorded for future reference.
Based on this data, you can analyze trends in key metrics—such as high-speed running and number of sprints—by season week and Match Day phase. With the Data Portal, you can also visualize cumulative workload trends across the entire team and automate comparative analysis between position groups. This provides a structured data environment that goes beyond simply checking numbers—helping you manage player condition and monitor growth over the course of the season.
Yes, absolutely. You can consolidate data from all teams within the club—from the first team to youth and academy squads—into a single platform.
Standardizing team data allows for seamless cross-team comparisons, long-term performance tracking, and clear visibility into player development pathways. This structured setup also makes it easy to compare training loads and performance levels by age group, supporting more strategic planning and risk management across the club.
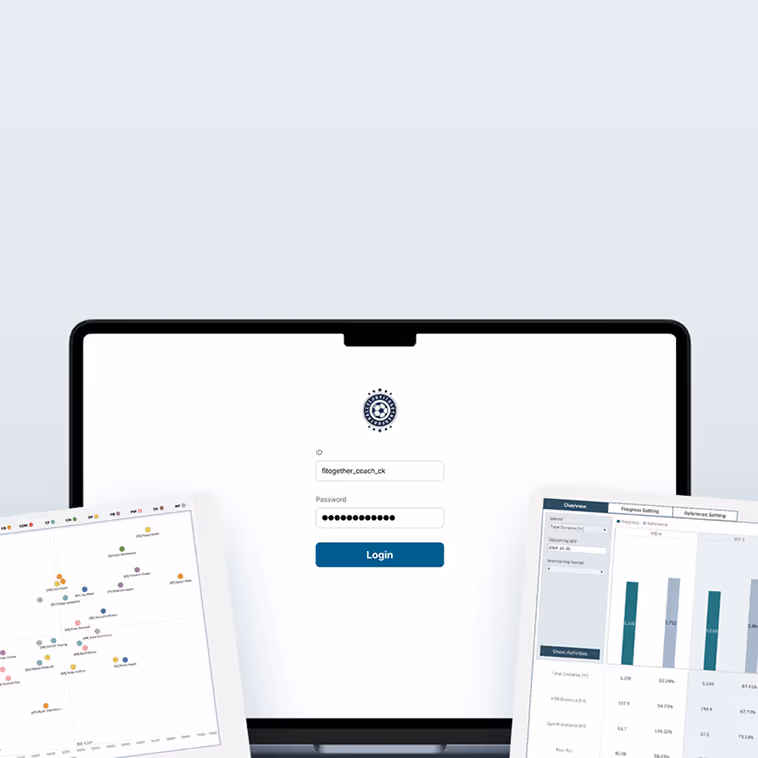
Certainly — and with minimal effort. With the Tableau-based Data Portal, you can build customized dashboards tailored to each team’s or coach’s specific analysis needs. These dashboards can be saved as templates and reused to automate recurring reports.
For example, you can generate a weekly “High-Speed Running and Playing Time Summary” report every Monday with just a single click. You have full flexibility to adjust chart types, filter settings, and comparison ranges based on your objectives—greatly reducing repetitive work. This can save over an hour of manual effort per report while improving both analytical efficiency and report quality. If needed, Fitogether experts can help design dedicated report layouts. We also offer user training and data visualization consulting to support the adoption of a strong data-driven culture across your organization.
*Custom layout design and consulting services are available as a paid option.
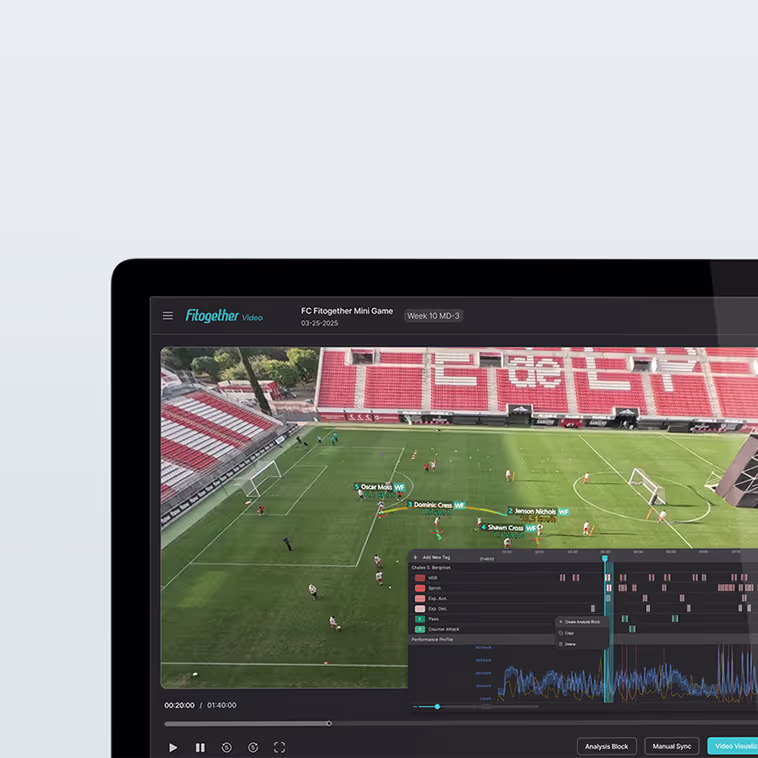
While the Advanced package focuses primarily on data reports, the Ultimate package includes a Video solution that allows you to save analyzed moments as video clips and share them along with key metrics. This feature is essential for teams that rely on video-based communication during tactical meetings or when providing player feedback.